 |
|||
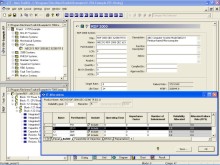
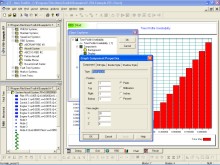
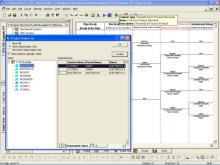
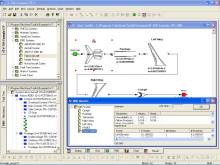
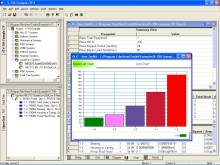
ITEM ToolKitFlexible, Easy-to-Use Interface, Viewing and EditingITEM ToolKit's easy-to-use User Interface makes it faster and easier to manoeuver throughout your project or system. You can view your Project or System information in a tabular grid, dialog box, hierarchy tree, chart or graph. You can also control the size and position of any window with standard WindowsTM functions. New Project or System data can be added via the hierarchy tree, dialog box, or in tabular grid. Editing is as simple as a click on any of the standard options such as Cut, Copy, Paste, and Drag and Drop. Advanced Grid / Tabular View You can add, edit and display the system information and structure in a Grid or “spreadsheet” view. Using filters and adding additional columns, you can customize this view to represent your system as you wish. Use this table as a report by simply dragging the table to Microsoft ExcelTM and share your analysis information with others. Powerful Chart and Graph Wizard ITEM ToolKit offers wide variety of charts and graphs for viewing systems and project data in a graph / chart format. You can choose to generate the charts automatically within ITEM ToolKit, or by using the Chart Wizard and Edit Graph functions, generating custom style charts. You can also save chart displays as image files for use in reports, presentations, etc. User Defined Custom Libraries Analyze your system once and create multiple, custom libraries containing components and block information, failure modes, cause and effects, events and fault trees. ITEM ToolKit allows you to create and use multiple libraries at the same time. This time saving feature will shorten the time for constructing new systems. The analyzed components, events or blocks can simply be added to a new system by using the drag-and drop or copy and paste feature. Importing data into ToolKit can also refer to the libraries to draw data from them, reducing the amount of information needed in the import source. Import/Export Facilities With ITEM ToolKit’s user-defined, powerful import and export facility, you can easily transfer any or all project information to your analysis. Data can move seamlessly to and from Bills of Materials (BOM), Excel, Access, text, and comma delimited file formats. You can also create and save Import and Export templates for repeated use. The result is an incomparable time saving over manual data entry. Hierarchy Diagrams Users can interactively construct hierarchy diagrams that represent the structure of a system at various levels. As new components are added to the system, each module automatically calculates and updates all dependent and overall system results. Download DemonstrationTo download a free demonstration of our ITEM ToolKit software click here.
Screen shots | click to enlarge
Features The most flexible and scalable reliability and risk software available Powerful chart and graph facilities Build and open multiple systems and project files User defined custom library facilities Drag and drop components and systems between projects Advanced hybrid linking and modeling Import and export data to Microsoft Excel, Access, Word, Bill of Materials, etc. Preformatted and fully customizable reports Information display management and sorting options Advanced transfer and link facilities Top-down and bottom-up Design, Process, functional, or system FMEA's supported Multiple FMEA standards supported: MIL-1629A, ISO 9000, ISO 26262, IEC 61508 Graphically constructed system hierarchy diagrams Automatic criticality calculations Redundancy modeling including hot standby Linked block facility reduces repetitive data entry
|
|||
|
|
|||