Fault Tree Analysis
ITEM ToolKit Module
Fault Tree Analysis (FTA)
Fault Tree Analysis uses tree structures to decompose system level failures into combinations of lower-level events, and Boolean gates to model their interactions.
To address safety and the ways failures or undesirable events could occur; and thereby, trying to avoid them can be very challenging. To improve system safety and reliability, designers and analysts have to make better-informed risk assessment decisions based on quantified evaluations of the risks and effects associated with alternative designs and other risk-mitigating actions.
These challenges are more compounded where manual methods of fault isolation and risk analysis in large and complex systems are not viable.
Using failure probability and system reliability data can assist you in addressing the undesirable events or challenges. Often times, Fault Trees are used in reliability and safety risk assessments to represent graphically the logical interactions and probabilities of occurrence of component failures and other events in a system.
A Fault Tree Analysis identifies and ranks combinations of events represented on a Fault Tree that cause system failure, and provides estimates of the system’s failure probability.
Using this detailed information, efforts to improve system safety and reliability can be highly focused and tailored to your individual system by using the quantitative results from the data you input. Additionally, Fault Tree Analysis can help prevent failures from occurring by providing you with data showing how and under what circumstances the failure could occur, allowing for alternative measures to prevent (or design out) the catastrophic failures or hazards.
The Boolean methodology and equations are used to construct and simplify the Fault Tree. As Fault trees are constructed, the Boolean equations are used to evaluate the Quantitative and Qualitative characteristic of a critical system.
The Qualitative analysis of the Fault Tree determines the: a) probability of system failure (top event) based on a single failure (basic event) cause or common cause potential using minimal cut sets, b) combination of component failures (minimal cut sets), c) importance ranking of contributors to system failure.
The Quantitative analysis of the Fault Tree focuses on the probabilities of system and cut set failure or the occurrence of the top event based on the probabilities of failure of the basic events.
Fault Tree Construction
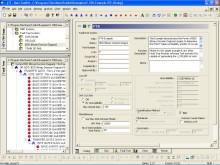
ITEM ToolKit's Fault Tree Analysis Software offers a diverse graphical user interface (GUI) flexible, powerful and easy ways for constructing Fault Trees. The GUI consists of menus, toolbars, and project and system windows. You can simply add different gates and events in the System Window to create a hierarchy of your system, ITEM ToolKit will construct the Fault Tree Diagram for you. Or, you can build your Fault Tree the traditional way by adding gates and events in the Diagram Window.
1 | 2 | >>
Download Demonstration
Download a free demonstration of our Fault Tree Analysis Software: click here.
Features

Powerful and user friendly fault tree analysis software
Calculates unreliability and unavailability
Analyses uncertainty, sensitivity and common cause failure (CCF)
Produces minimal cut sets
Identifies fault tree sequencing
Defines event failure models
Determines the importance of elements in a system
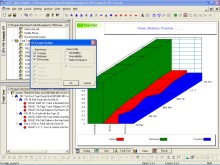
Powerful charting facilities
Import and export to MS Excel, Access, Word etc.
Multi-document interface allows easy transfer of data
Links to Event Tree Module
Advanced hybrid linking and modeling